
Exploring centralized logging can be a very handy for application operation engineer / administrator when they are trying to take care of day to day operations.
It eases the application administrator to find out root cause of the application issues. It centralize the multiple application logs at one place, so that the operation team can be shared pool model to support the multiple applications instead of dedicated resource for each application operation
There are several ways to take care of this stuff. All of them come with a number of pros and cons but if you are looking for Scalable, Reliable Log Analytics, going for Kibana, Elasticsearch and Logstash might be what you are looking for.
Carrying out centralized logging with Logstash is a complicated job as it requires you to take care of every little detail with extreme amount of care. If you manage to add even a little detail that is wrong, there is a good chance that your logging may never work properly.
A few details on how you may utilize these tools to your benefit are discussed below for your convenience and understanding. Before starting off with the configuration process, we would like you to consider the following prerequisite disclaimer points:
- You can use whatever operating system you want to. Since this guide makes use of Ubuntu, using the same operating system is recommended in order to achieve the best results.
- All the three above mentioned tools may be run on the same server. However it is recommended to use different tools on different servers according to the workload and then interlink them to achieve better functionality.
- This guide offers a few details on the most basic features offered by the three tools. You need to first master these basic techniques and then you may incorporate the advanced techniques in order to take care of things in a better way.
Now in order to get started with centralized logging using Kibana, Elasticsearch and Logstash, you need to follow the instructions listed below to install and configure ELK stack
Pre-requisite:
- Java Installation
Elasticsearch requires JAVA 1.8 runtime. Follow the below steps to install java
- Adding Java repository to the software source list
$ sudo add-apt-repository ppa:webupd8team/java
$ sudo apt-get update
- Install the java using the command
$ sudo apt-get install oracle-java8-installer
Download Kibana, Elasticsearch and Logstash latest packages to get started. There are different packages that may easily be found on the elastic.co website. You may stick with the one that appears to be the most convenient or latest.
- Elasticsearch Installation and Configuration
Elasticsearch Installation
- Open https://www.elastic.co/downloads/elasticsearch and find the deb file. Right-click the deb file and copy the link address, Use the following command to download the elasticsearch package.
$ sudo wget https://artifacts.elastic.co/downloads/elasticsearch/elasticsearch-5.2.0.deb
- Install elasticsearch package using following command
$ sudo dpkg -i elasticsearch-5.2.0.deb
Elasticsearch Configuration
- Now it is time to edit the configuration file of your Elasticsearch. You can do that by going to /etc/elasticsearch/elasticsearch.yml. Once you are there, you need to make the following edits, by entering into elasticsearch configuration file using the below command
$ sudo vi /etc/elasticsearch/elasticsearch.yml
- Find ‘cluster.name’ and then remove the comment symbolization. This would set up a new cluster.
- Now find ‘node.name’ and put in a name here (it can be custom or default)
- You do not necessarily have to do above steps as elastic search usually does that automatically. However it is a good practice to do so as knowing about your servers comes in handy later.
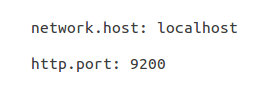
- Network Configuration (IP address and port number )
Start / Stop Elasticsearch service
- You can start and stop the Elasticsearch service using following commands
$ sudo service elasticsearch start
$ sudo service elasticsearch stop
Checking Elasticsearch in terminal
- After starting Elasticsearch you can access and ensure the elasticsearch using terminal by below command
$ curl -XGET ‘http://localhost:9200‘
Searching data using query in Elasticsearch
- Once the data is saved in Elasticsearch you can search and find the data using query.

- Logstash Installation and configuration
Logstash can act as Shipper and Collector. Logstash can implement in application server for collecting and shipping the application log files to Elasticsearch. Logstash using Input, Filter and output plugins for executing operations.
Logstash Installation
- Open https://artifacts.elastic.co/downloads/logstash and find the deb file. Right-click the deb file and copy the link address, Use the following command to download the logstash package
$ sudo wget https://artifacts.elastic.co/downloads/logstash/logstash-5.2.0.deb
- Install using the below command
$ sudo dpkg -i logstash-5.2.0.deb
Logstash Configuration
- By default the package will not come up with logstash configuration file. So you need to create a new configuration file under /etc/logstash/conf.d/ by using below command.
$ sudo vi /etc/logstash/conf.d/logstash.conf
- Sample configuration of logstash

Logstash Configuration Checking
- Logstash has options to check the configuration using following commands
$ sudo /usr/share/logstash/bin/logstash –path.settings /etc/logstash -f /etc/logstash/conf.d/logstash.conf
Start/Stop Logstash service
- Start and Stop the Logstash service using below commands
$ sudo service logstash start
$ sudo service logstash stop
- Kibana installation and configuration
Kibana tool is used to visualize the application logs in some graphical representation.
Kibana Installation
- Open https://www.elastic.co/downloads/kibana and find the deb file. Right-click the deb file and copy the link address, Use the following command to download the kibana package.
$ sudo wget https://artifacts.elastic.co/downloads/kibana/kibana-5.2.0-amd64.deb
- Installing Kibana
$ sudo dpkg -i kibana-5.2.0-amd64.deb
Kibana Configuration
Kibana must be configured to get data from Elasticsearch
- To configure the Kibana goto /etc/kibana/kibana.yml
- Find and change the Server port, Server host and Elasticsearch url

Start and Stop Kibana Service
- Use following commands to Start and Stop the service
$ sudo service kibana start
$ sudo service kibana stop
- Once you are done, you may now check Kibana out. Hopefully you will be able to see different log entries there. You can try going through the different options offered by the environment in order to see if everything is up to the mark or not.
- Keep in mind that it is a very good practice to document all the different steps involved in the process as it may turn out to be very useful when you are trying to reconfigure it sometime on a new or your existing system in case you come across some issues that compel you to do so.
CloudJournee specializes in number of cloud related services. We have highly qualified and experienced professionals who specialize in carrying out these kind of services. We help customers by implementing Reliable, Scalable and centralized logging using ELK stack.


