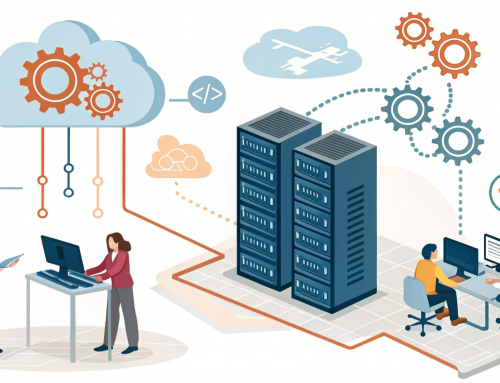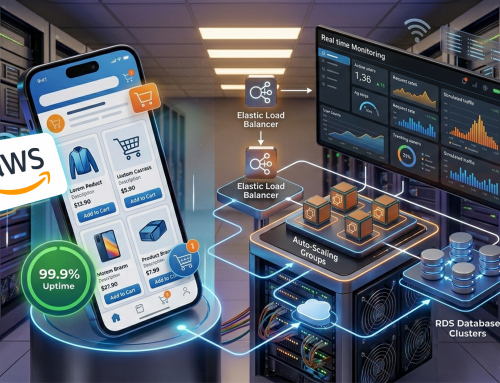

A global premium automotive manufacturer partnered with CloudJournee to replace manual, reactive operations across its sales and service applications with a centralized, AWS-native Cloud Operations model. By consolidating telemetry from 27+ AWS accounts, adding outside-in synthetic monitoring and automating the path from alarm to incident ticket, the company cut mean time to detect by 88%, reduced mean time to resolve by 77% and raised application availability to 99.95%.
Client Overview:
The client is a global premium automotive manufacturer. Its sales and service application portfolio supports core commercial processes: vehicle ordering, dealer and customer relationship management, after-sales service and parts, and finance and leasing. Dealers and internal teams reach the platform over a private corporate connection, while customers use public digital channels protected at the network edge.
Every application runs on a standardized container platform built on Amazon ECS (Fargate), with each application in its own account following an identical pattern. The portfolio had already moved from a legacy on-premises Java and Oracle stack to a cloud-native architecture on AWS. This engagement delivered the Cloud Operations foundation the modernized platform depends on.
Business Challenge
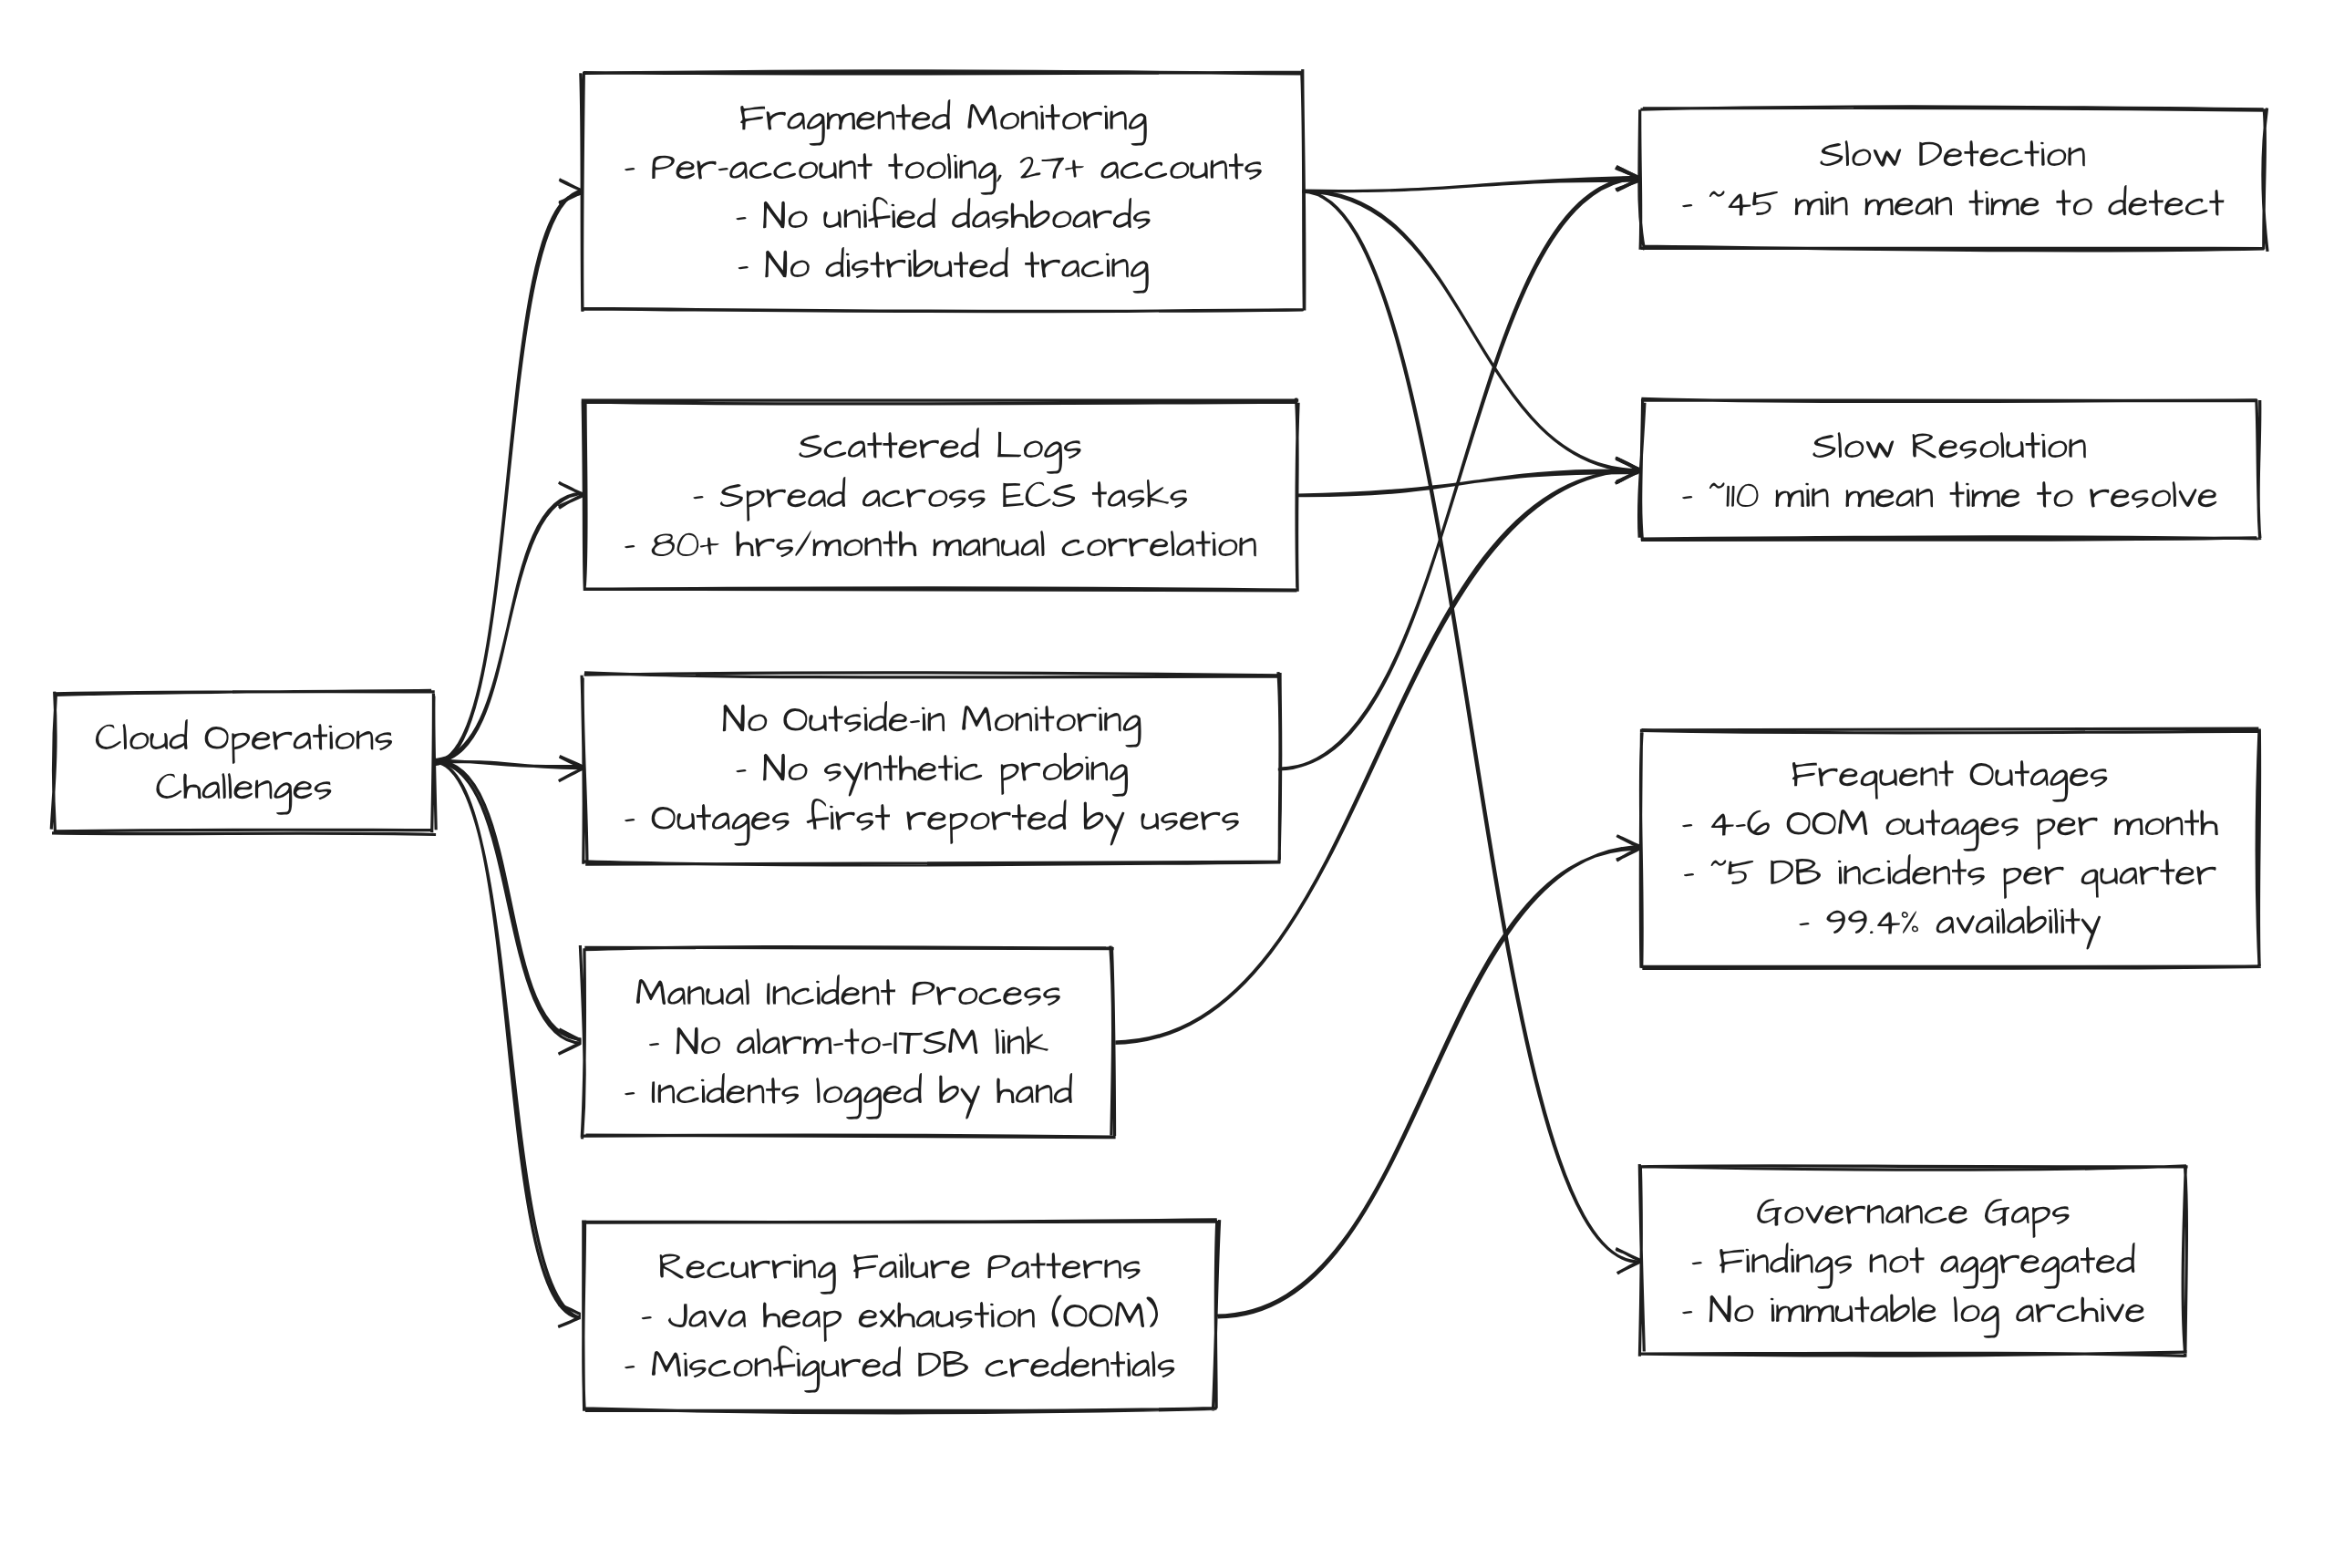
Although the applications ran on a multi-account AWS footprint, day-to-day operations still relied on manual effort, fragmented tooling and reactive troubleshooting:
- Limited end-to-end visibility: No consolidated view of container, load balancer and database health per application, so troubleshooting depended on tribal knowledge.
- Scattered logs: Application and container logs were spread across individual ECS tasks and 27+ accounts, with no central aggregation or correlation.
- No outside-in monitoring: Without synthetic probing of application endpoints, the first sign of an outage was usually a user report.
- Recurring, preventable failures: Java out-of-memory errors and misconfigured database credentials caused repeated outages that surfaced only after users were affected.
- No distributed tracing: Requests crossing several load-balancing hops and container tiers could not be followed end to end.
- Fragmented governance and audit evidence: CloudTrail, AWS Config and security findings were not aggregated organization-wide, and there was no immutable log archive.
- Manual incident handling: Infrastructure alarms had no automated link to the enterprise ITSM process, so incidents were identified and logged by hand.
Challenge:
Implementation Plan:
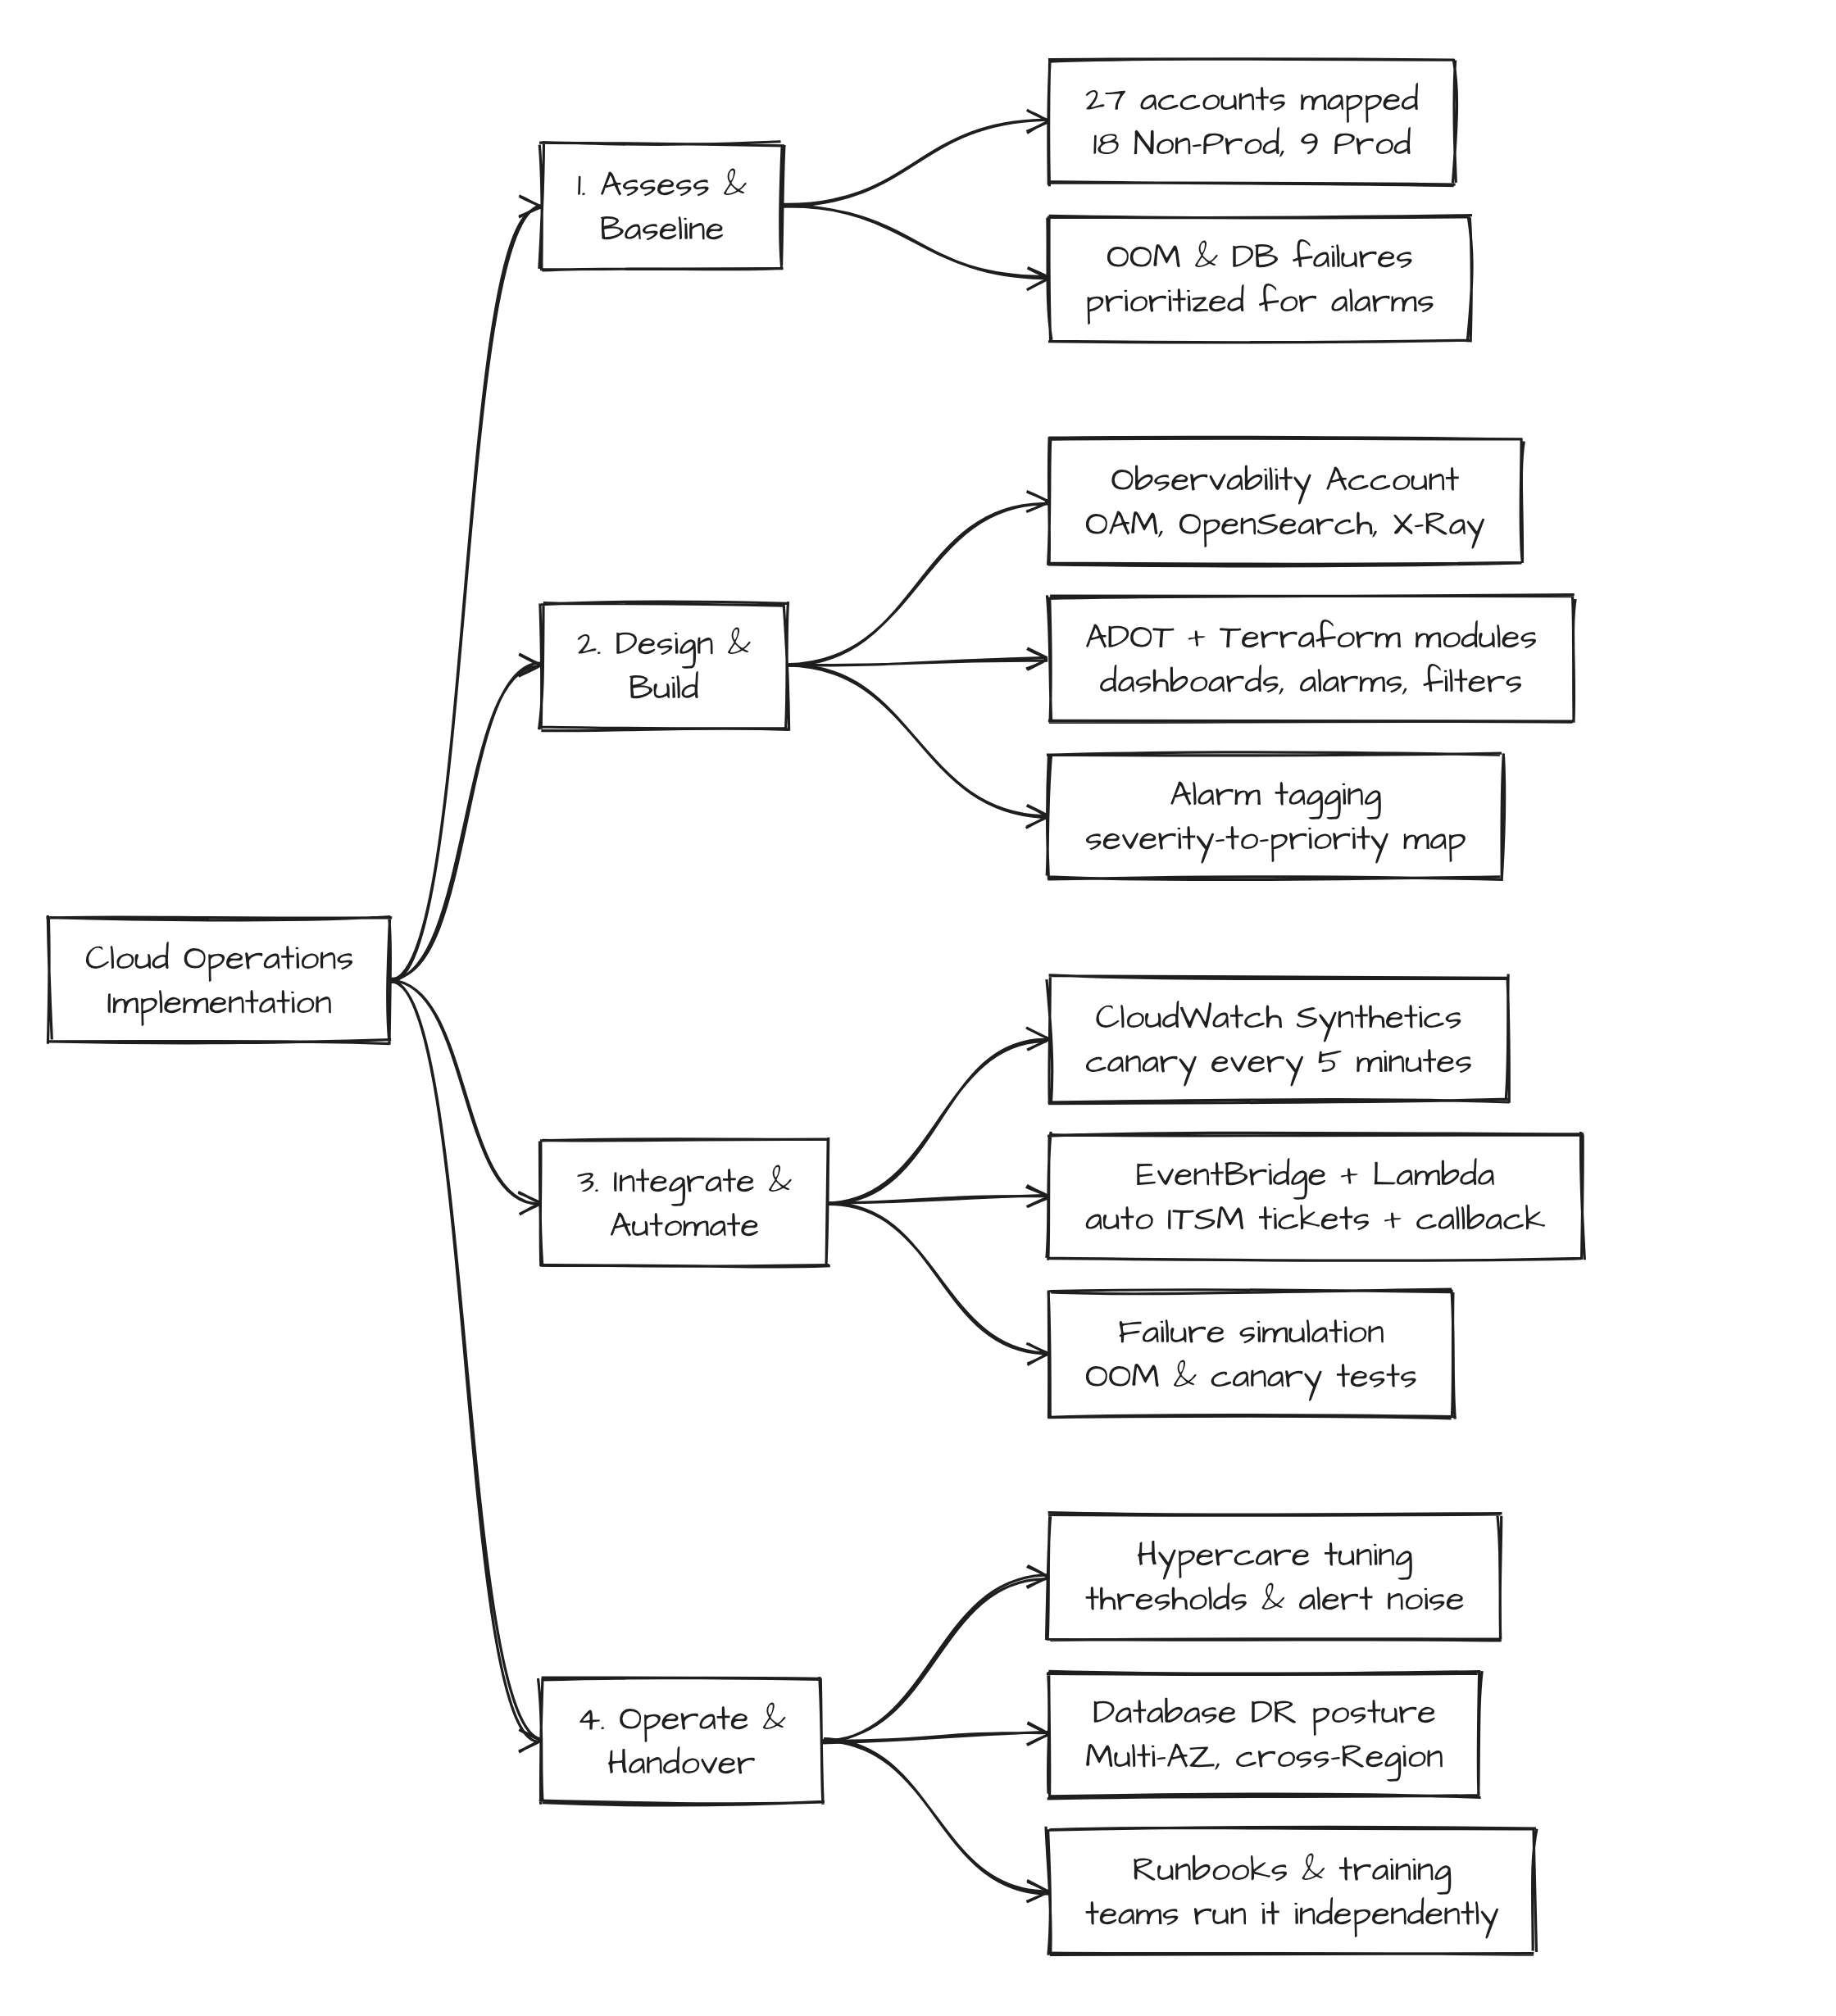
- Assess & Baseline: Mapped the account structure (18 non-production and 9 production accounts, plus shared security, log archive and network accounts), the application portfolio and its ECS services; reviewed telemetry coverage account by account; and catalogued recurring incident patterns to prioritize alarm coverage.
- Design & Build: Designed a dedicated Observability Account, instrumented the container tiers with AWS Distro for OpenTelemetry, defined a mandatory alarm tagging convention and severity-to-priority mapping, and built Terraform modules for dashboards, alarms and log metric filters.
- Integrate & Automate: Deployed CloudWatch Synthetics canaries, built the automated detection-to-ticket pipeline with a resolution callback, configured log-pattern alarms, and validated detection by simulating out-of-memory conditions and canary failures.
- Operate & Handover: Rolled out in phases with a hypercare period to tune alarm thresholds, established the database disaster recovery posture, and trained the client’s operations teams to run the platform independently.
Solution
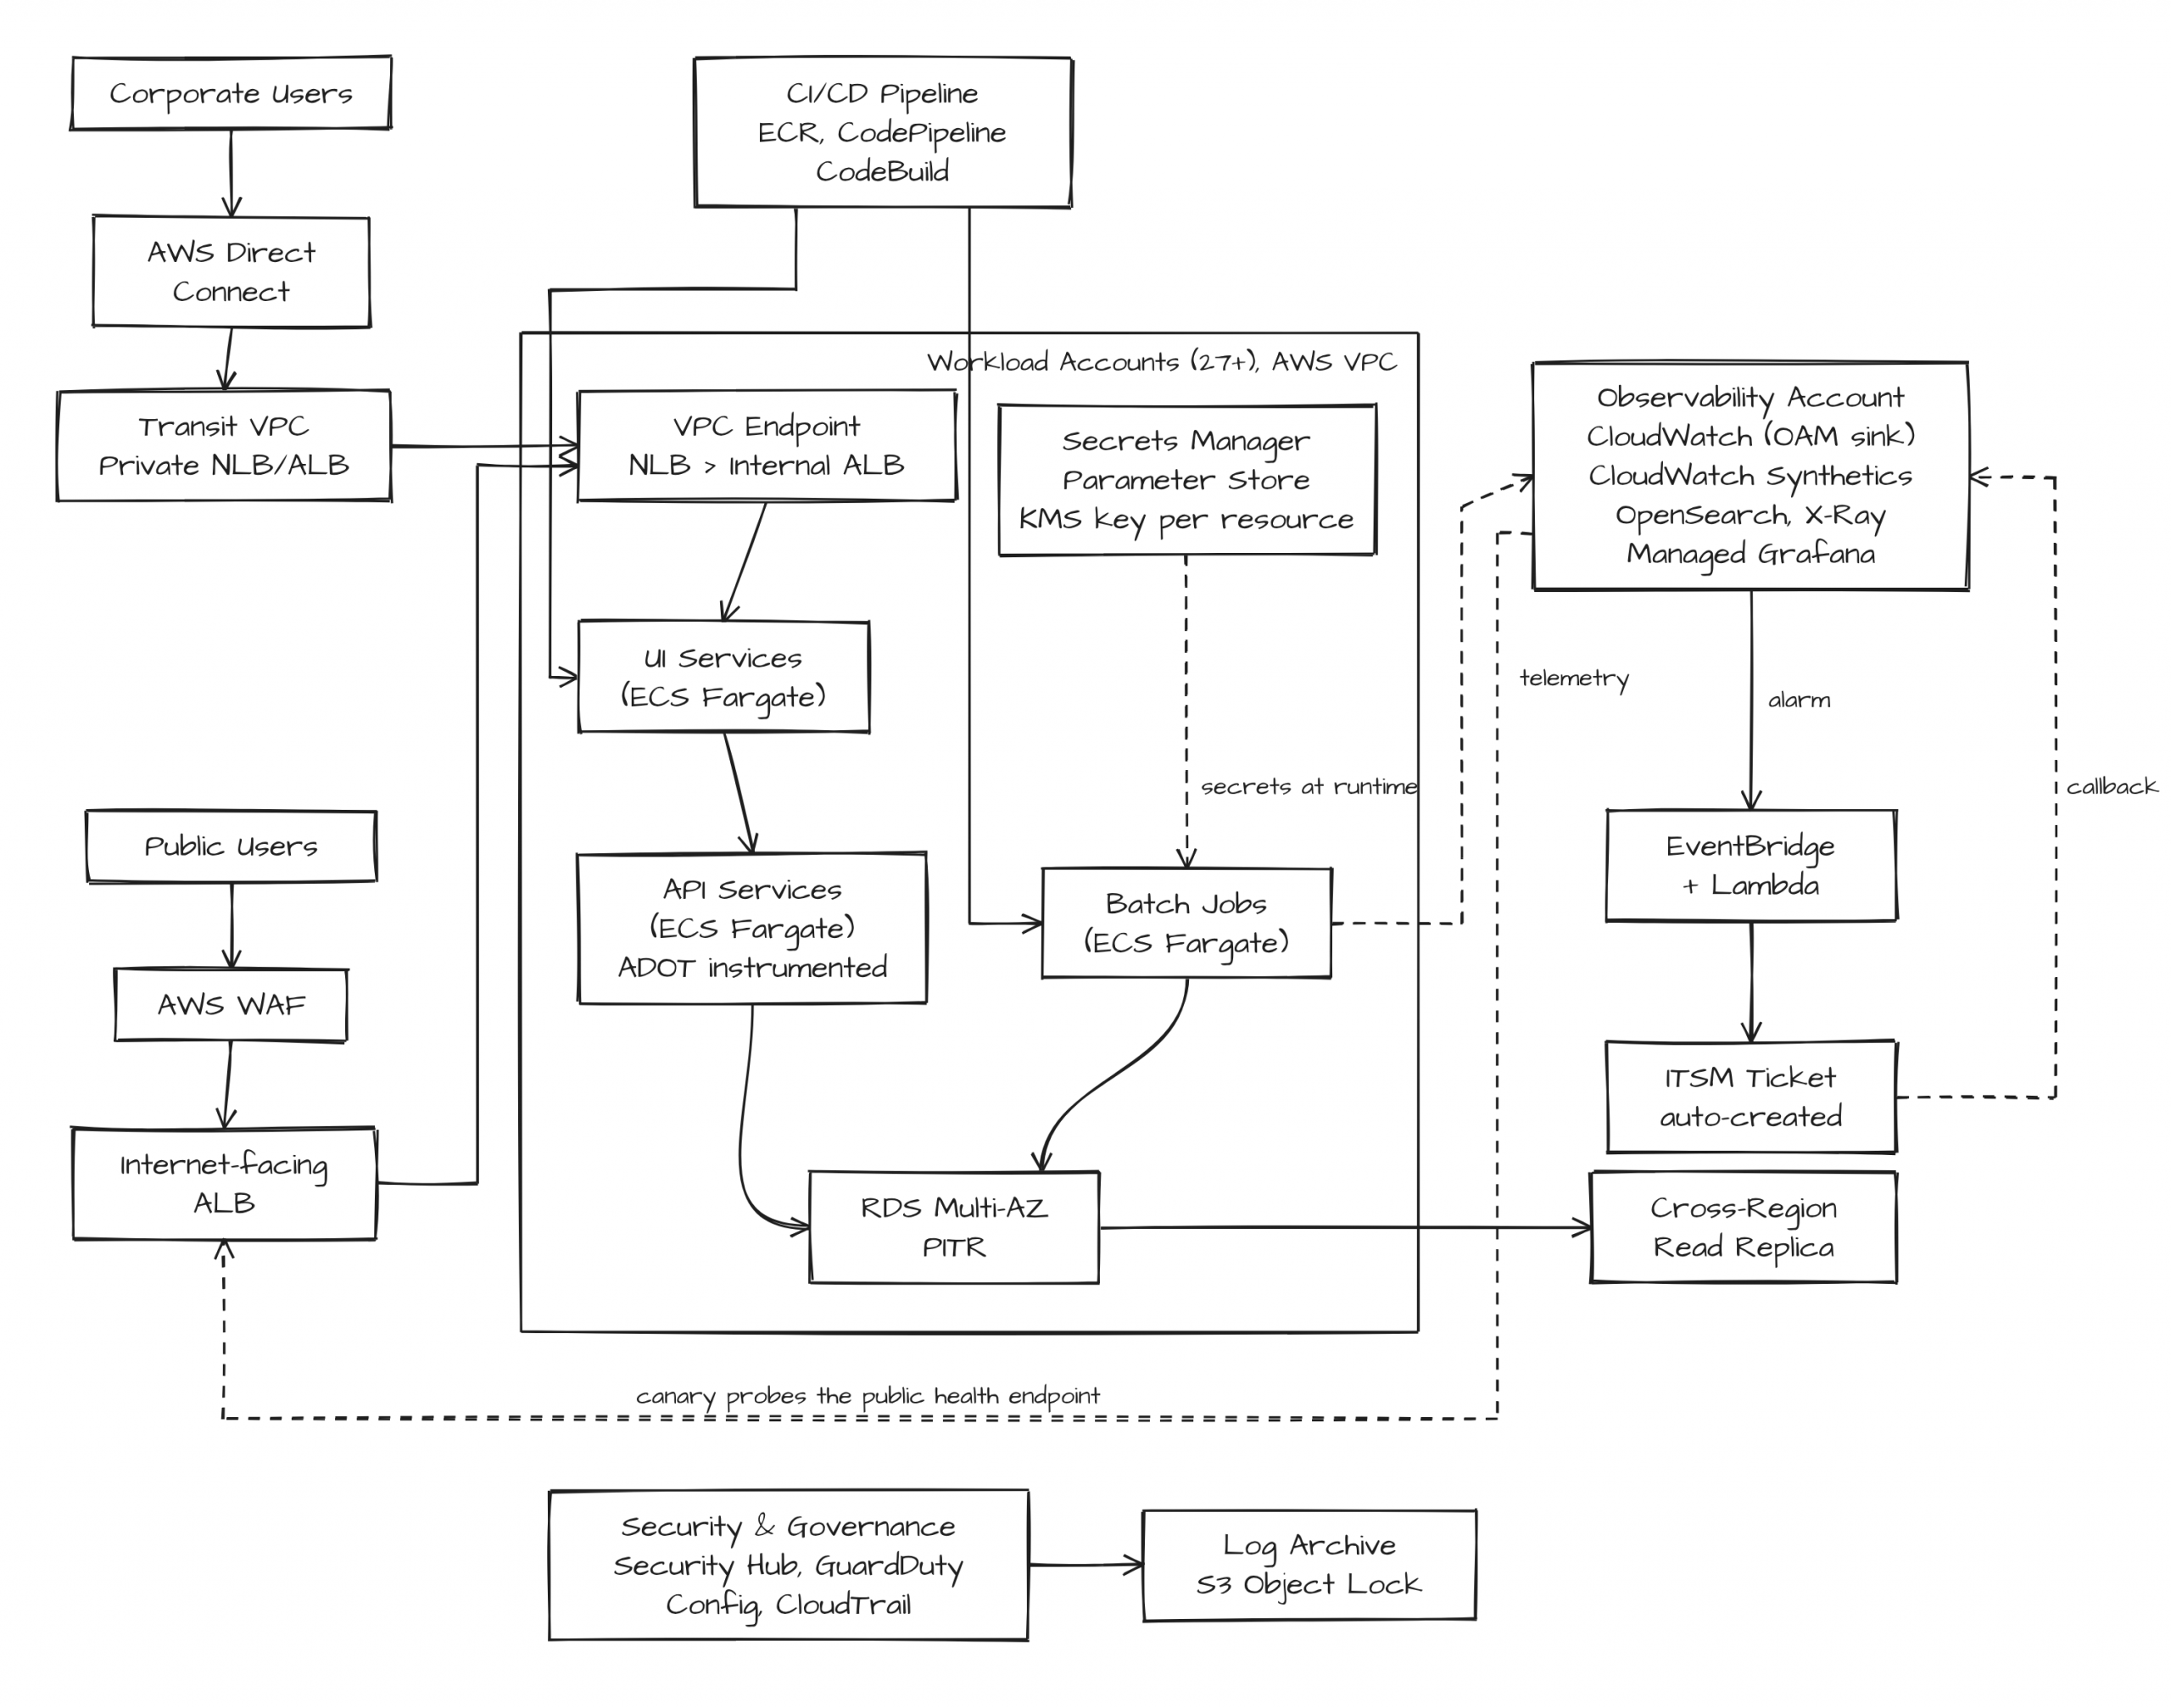
Centralized Observability:
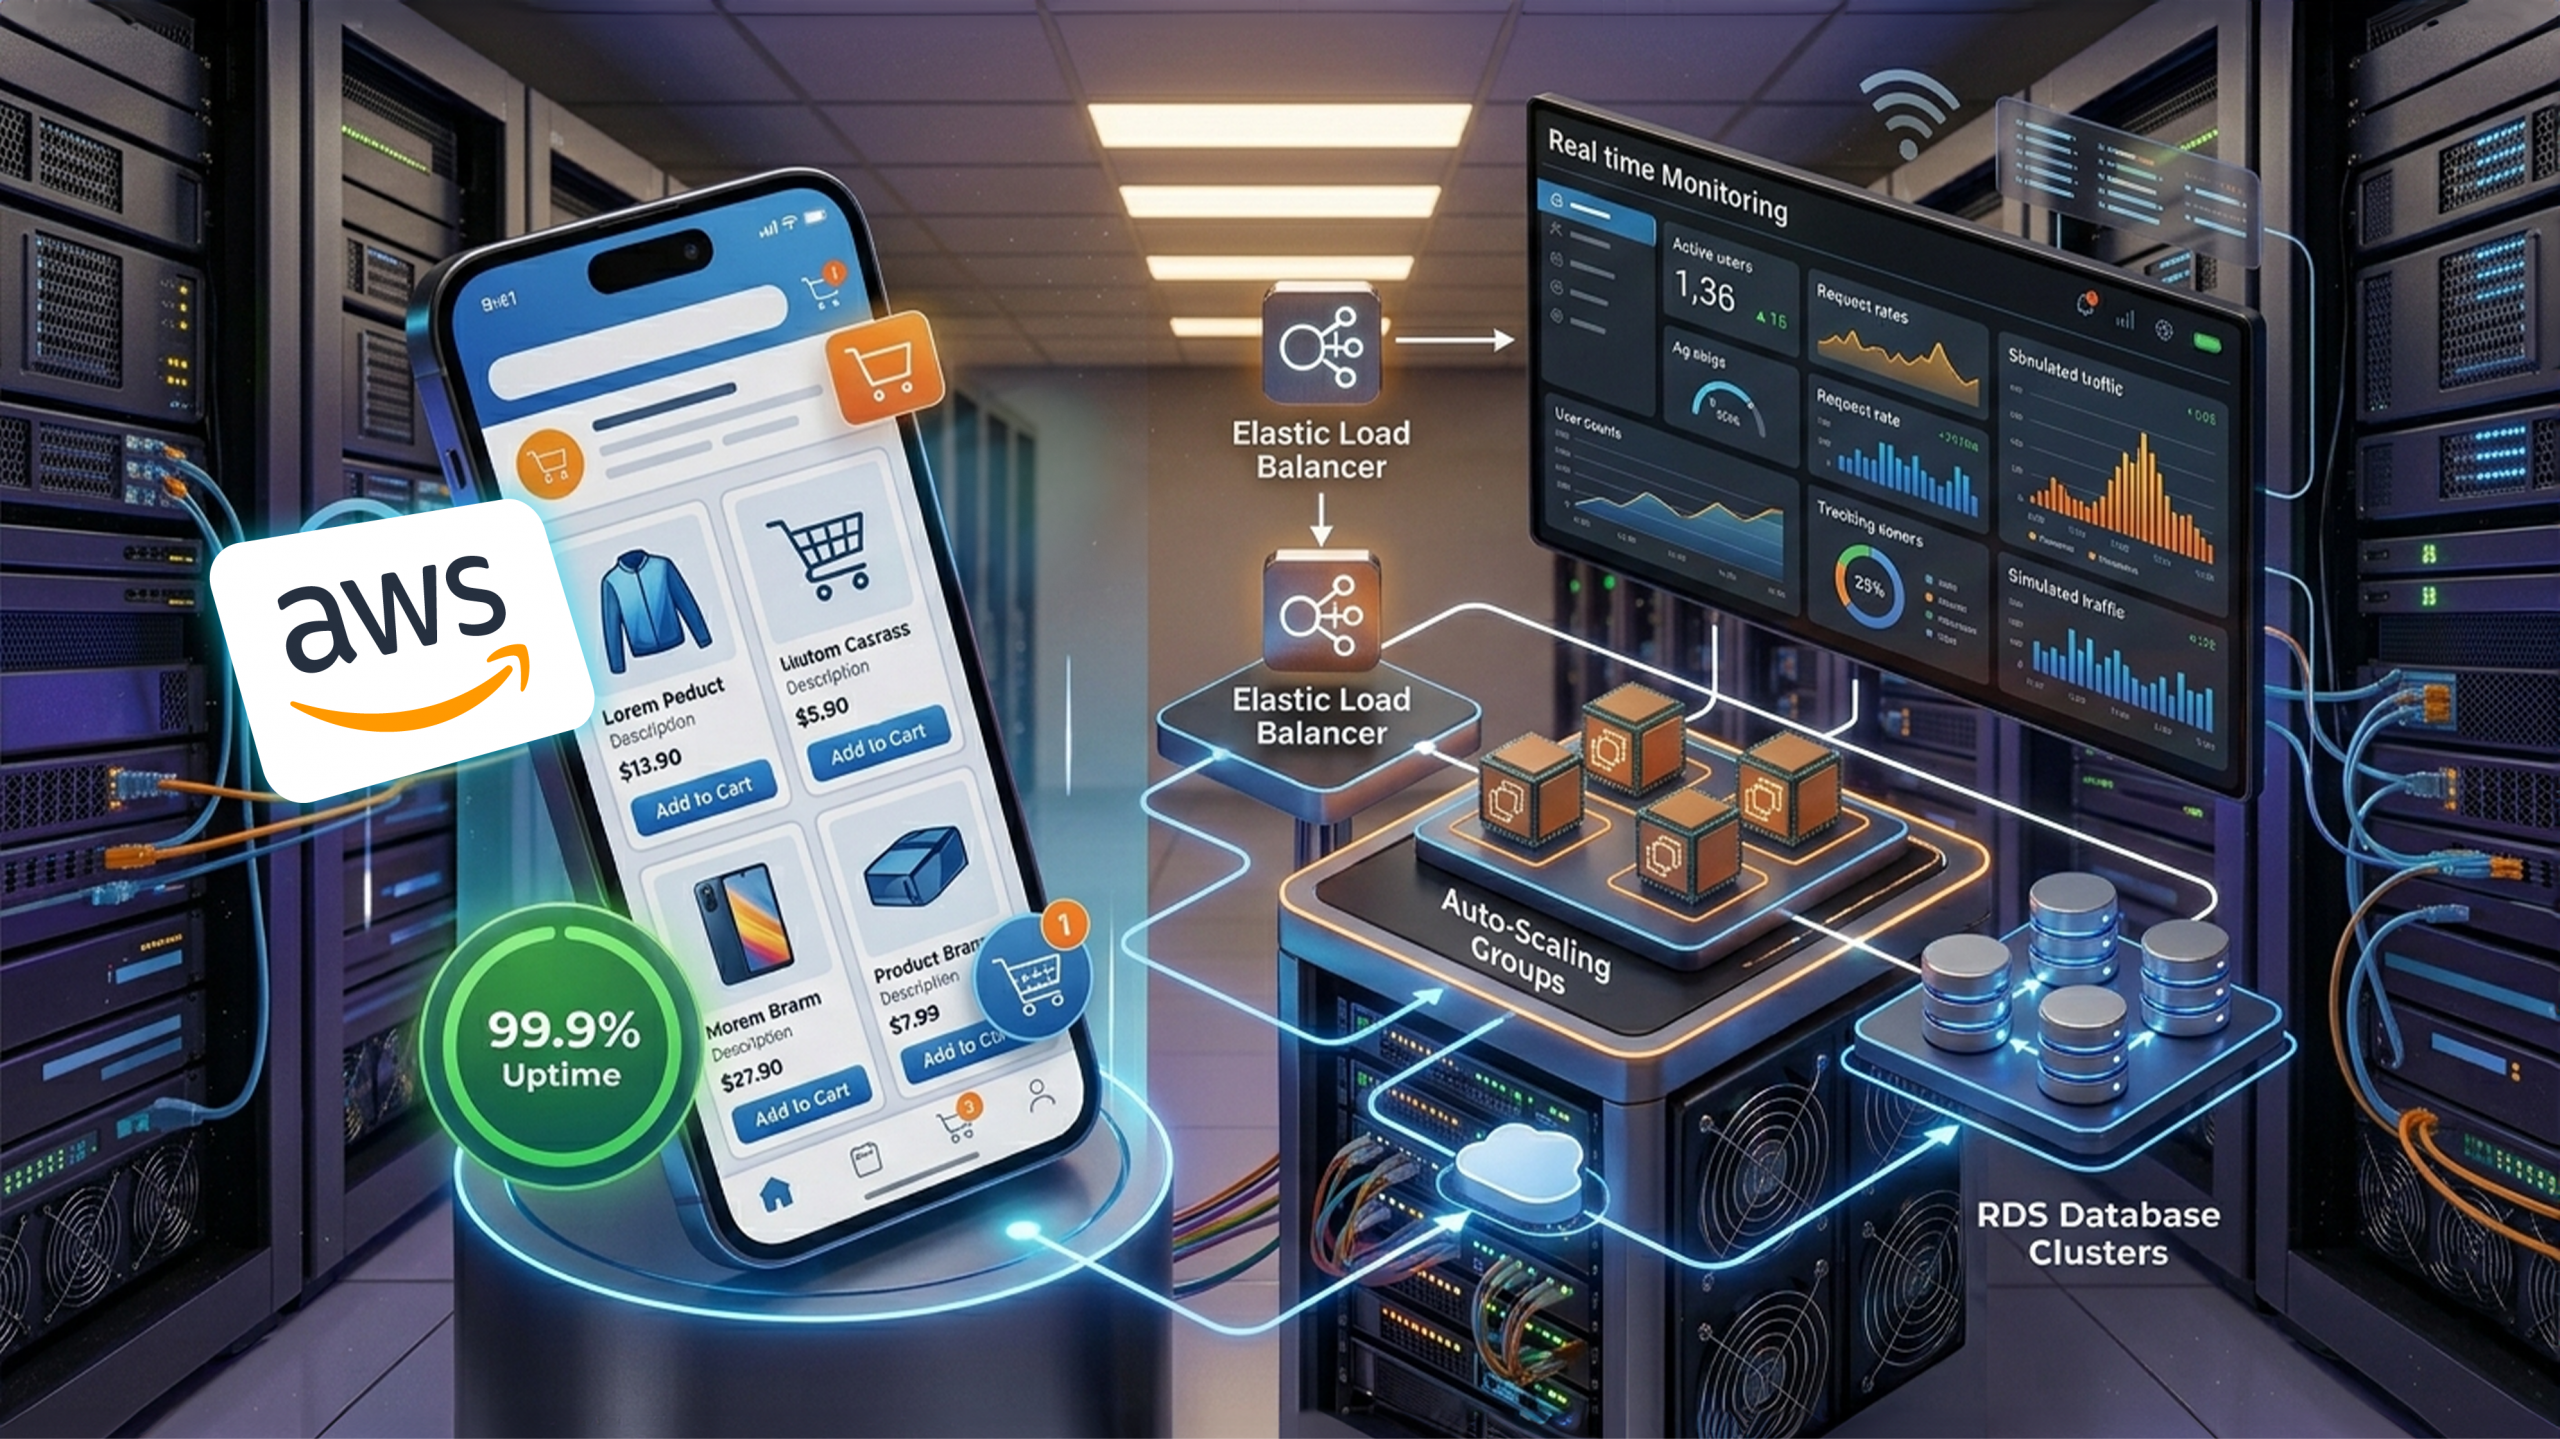
- A dedicated Observability Account with an Amazon CloudWatch Observability Access Manager (OAM) sink and source links from member accounts, giving operations teams one console instead of 27+.
- Centralized CloudWatch metrics, logs, alarms and dashboards, with Amazon OpenSearch Service for log analytics and Amazon Managed Grafana for visualization.
- AWS Distro for OpenTelemetry on ECS tasks, exporting traces to AWS X-Ray so a single request can be followed across application tiers.
- Telemetry captured at every hop of the internal and public traffic paths: ECS Container Insights and task logs, load balancer access logs, VPC Flow Logs, AWS WAF logs and Amazon RDS Performance Insights.
Synthetic Monitoring:
- Amazon CloudWatch Synthetics canaries probe a standardized REST API health endpoint for each production application every five minutes, through the public ingress path.
- Alarms on canary success rate and duration feed the incident pipeline, and new applications inherit the same canary definition, schedule and thresholds.
- Each canary parses the health response to confirm database connectivity, so a connection failure is raised as an incident before users are affected.
Detection-to-Incident Automation:
- CloudWatch alarm state changes flow through Amazon EventBridge to an AWS Lambda processor that adds application and environment context.
- A resolution callback updates or closes the CloudWatch record when the ticket is resolved, closing the loop between monitoring and incident management.
- CloudWatch Logs metric filters alert on out-of-memory signatures and connection-failure messages alongside resource and canary metrics.
- Incident tickets are created automatically in the client’s ITSM system and routed by a mandatory alarm tagging convention, with alarm severity mapped to ticket priority.
Security, Governance and Resilience:
- Organization-wide aggregation of findings through AWS Security Hub, Amazon GuardDuty, AWS Config and IAM Access Analyzer.
- Amazon RDS Multi-AZ with point-in-time recovery, a cross-Region read replica and a disaster recovery runbook executed through AWS Systems Manager Automation.
- Database credentials moved to AWS Secrets Manager and injected into ECS tasks at runtime, with a dedicated AWS KMS key for each resource.
- A dedicated Log Archive account using Amazon S3 Object Lock with a defined retention period for CloudTrail and AWS Config logs.
Benefits and Key Values Realized:
| Metric | Before | After | Improvement |
|---|---|---|---|
| Mean time to detect (MTTD) | ~45 minutes | < 5 minutes | 88% reduction |
| Mean time to resolve (MTTR) | ~110 minutes | ~25 minutes | 77% reduction |
| Java out-of-memory outages | 4–6 per month | 0 per month | 100% reduction |
| Database connectivity incidents | ~5 per quarter | 0 per quarter | 100% reduction |
| Manual log correlation effort | 80+ hours per month | < 10 hours per month | 87% reduction |
| Application availability | 99.4% | 99.95% | Downtime cut from ~4.4 hours to ~22 minutes per month |
| Synthetic canary success rate | No synthetic monitoring | 99.98% | New capability |
| Incidents raised automatically | < 5% | 98% | 93 percentage-point increase |
| Column 1 Value 9 | Column 2 Value 9 | Column 3 Value 9 | Column 4 Value 9 |
| Column 1 Value 10 | Column 2 Value 10 | Column 3 Value 10 | Column 4 Value 10 |
Customer Quote:
“Before CloudJournee, we usually found out about problems from our users, and our engineers spent hours piecing logs together across dozens of accounts. Now we have one operational view across the whole portfolio, synthetic checks that catch problems before customers notice, and alarms that raise tickets in our ITSM system on their own. Mean time to detect has dropped from about 45 minutes to under five, and the out-of-memory and database credential failures that used to cause repeated outages have stopped. Our operations team now runs the platform with confidence.” – Senior Technology Director, Leading Automotive Manufacturer
Realized Customer Values
Operational Excellence
- One operational view across the portfolio, replacing console switching during incident triage.
- Operations teams running the platform independently, with documented runbooks and escalation paths.
- A standardized, ITSM-integrated incident workflow with consistent severity-to-priority mapping.
Reliability and Customer Experience
- Availability problems detected on a five-minute cycle instead of by user report.
- Credential-related connectivity failures removed at source through runtime secret injection.
- Out-of-memory outages eliminated by using centralized telemetry to right-size task memory and tune JVM garbage collection.
Scalability
- New applications inherit dashboards, alarms, canaries and ticket routing without bespoke configuration.
- Account-level isolation contains the impact of an issue to a single application.
- Terraform modules standardize observability across applications and accounts.
Security and Governance
- A tamper-evident, retention-controlled log archive supporting audit and compliance requirements.
- Least-privilege, role-tiered access scoped per environment and per account.
- Continuous, organization-wide visibility of security and configuration findings.
Conclusion
CloudJournee transformed the manufacturer’s sales and service platform from a reactive, manually operated environment into a proactive, AWS-native Cloud Operations model. Centralized observability, outside-in synthetic monitoring and automated incident handling now detect issues in under five minutes on average and resolve them in about a quarter of the previous time, while recurring out-of-memory and credential failures have been eliminated. The repeatable operating model gives the client a scalable foundation for every new application it brings onto the platform.