
CloudJournee helped a leading U.S. humanitarian organization turn a fragmented monitoring estate into a single, correlated observability and incident-response model for its emergency assistance platform on Amazon EKS. The platform now detects its own failures: mean time to detect fell from about 35 minutes to under 5 minutes, mean time to restore from about 90 minutes to under 30 minutes, and all four critical user journeys are verified continuously at ≥98% availability.
Customer Overview
Business Challenge
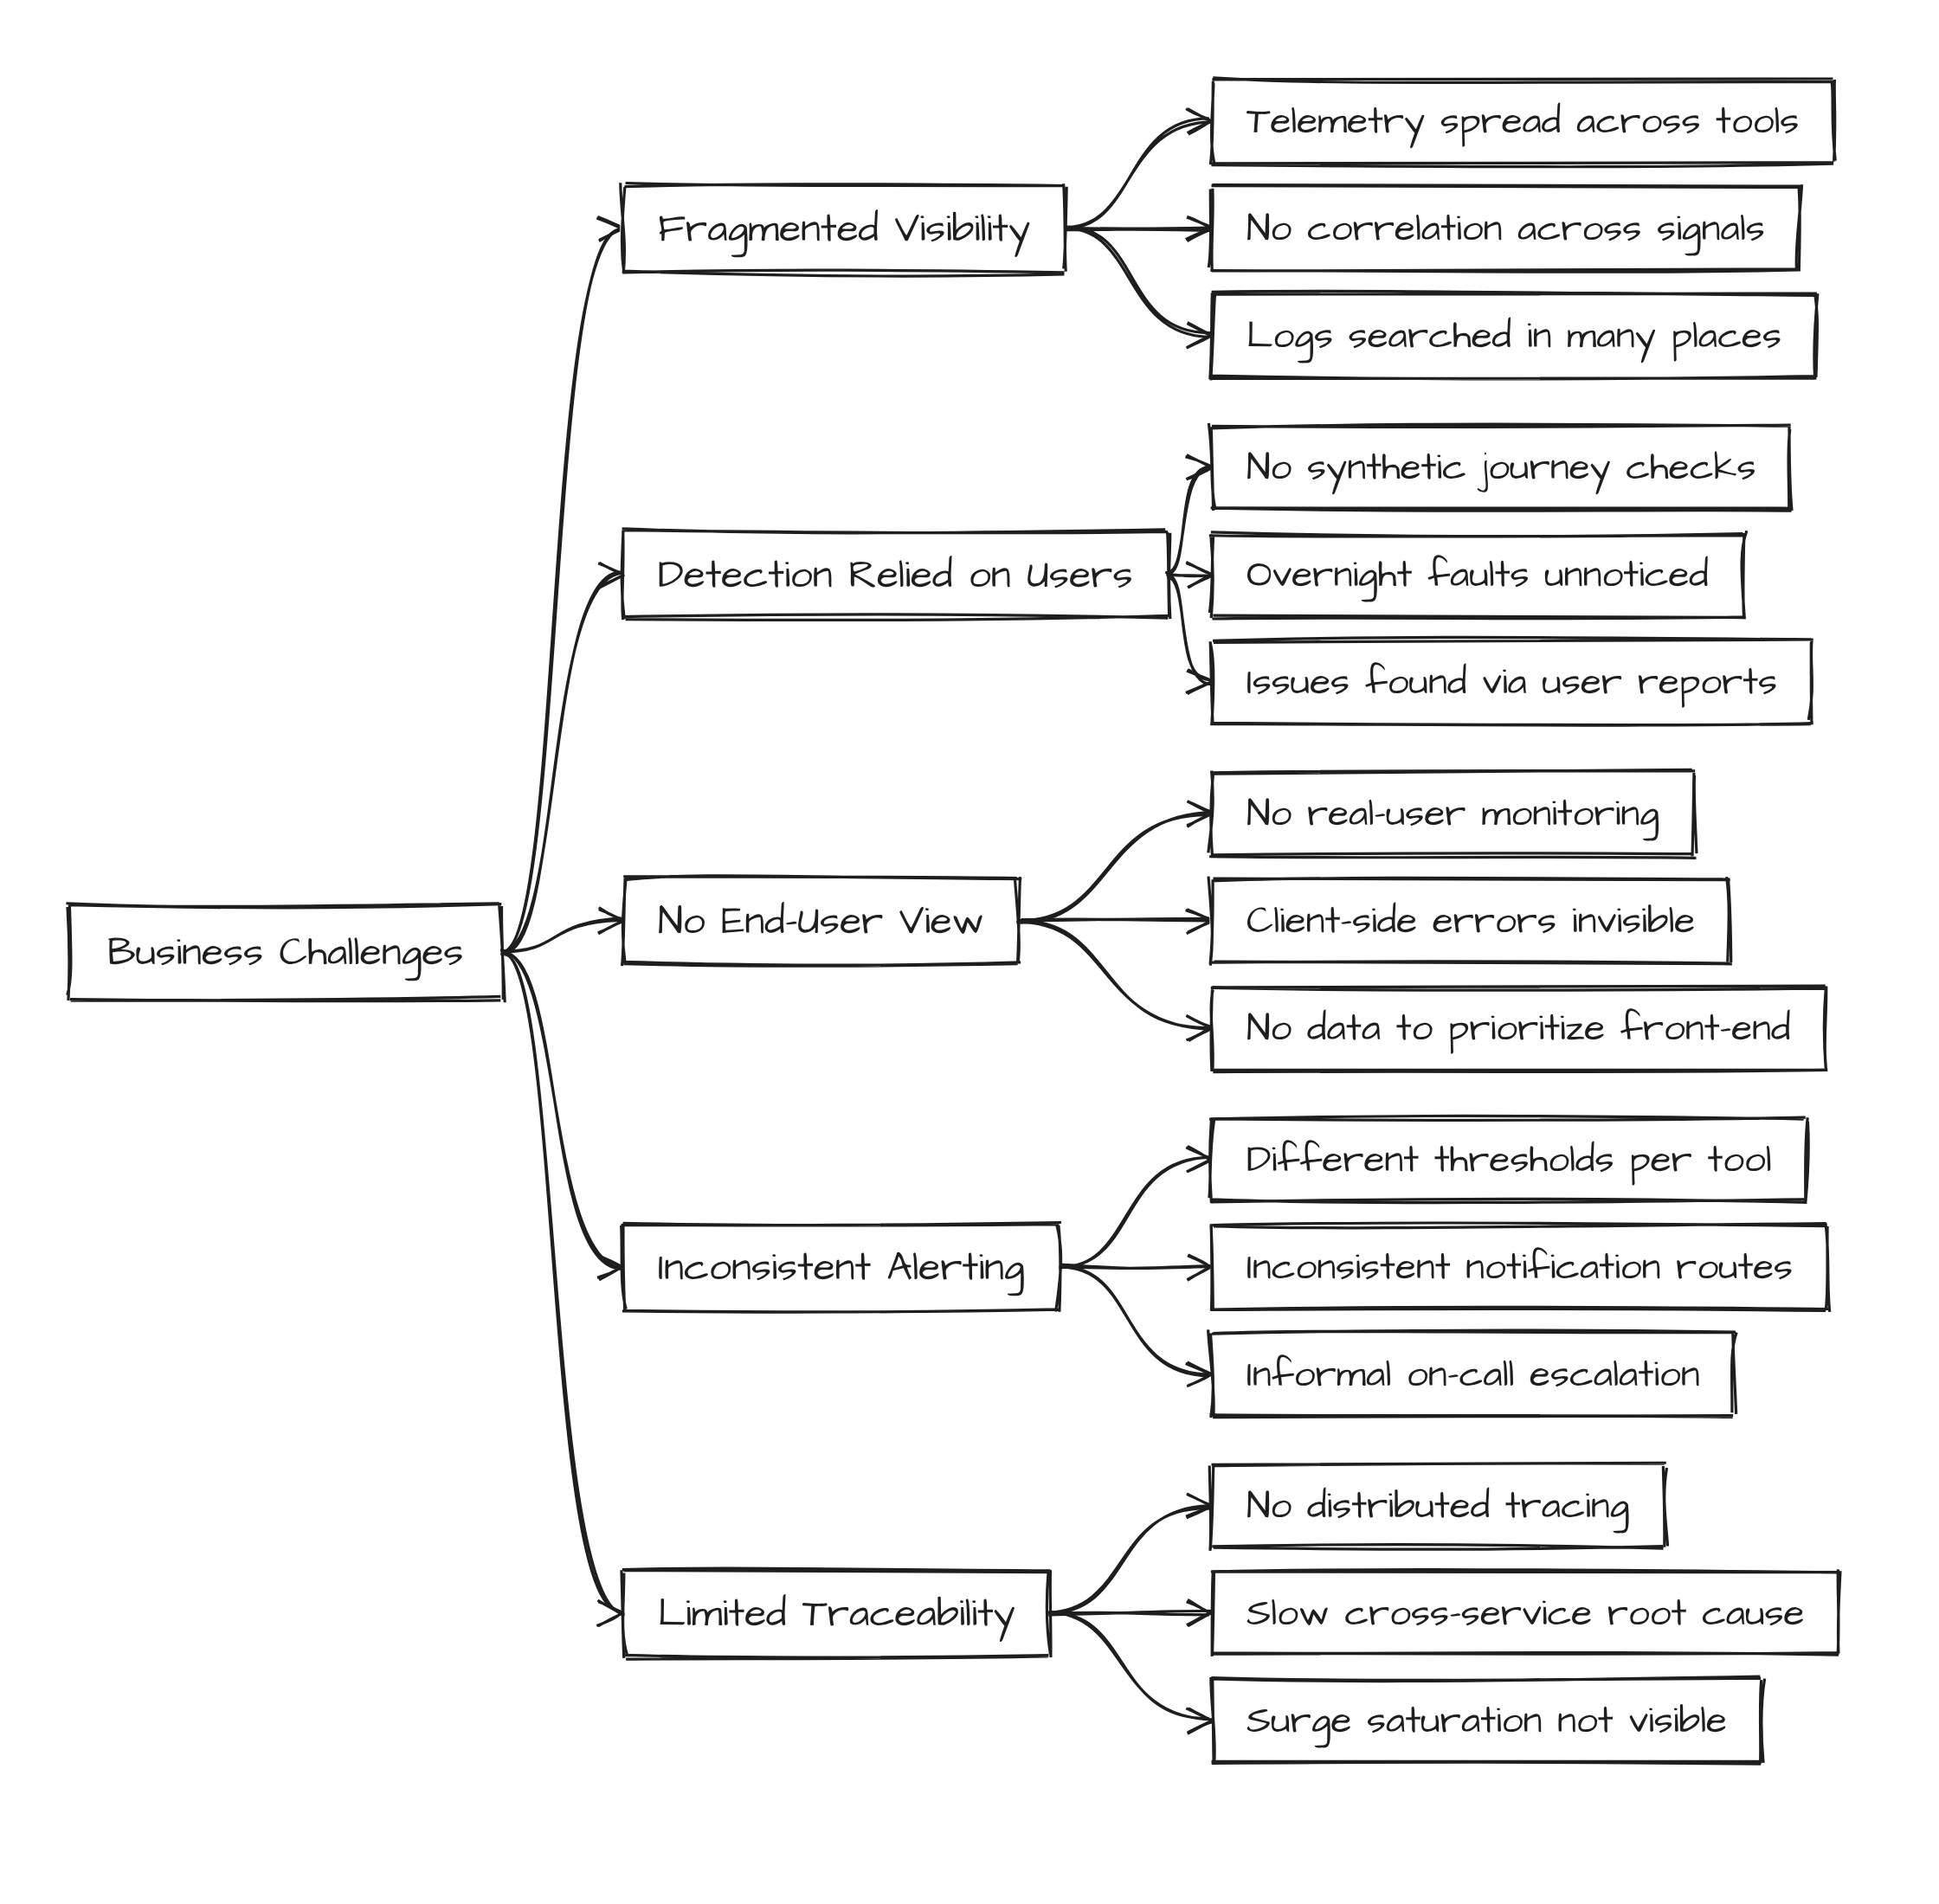
Fragmented Visibility
- Telemetry was spread across independent systems with no correlation between them.
- Finding the source of an issue was a manual exercise that depended on knowing which tool held which signal.
Detection Dependent on Users
- Critical user journeys were not verified continuously, so many issues became known only when users reported them.
- Faults during low-traffic periods, including overnight, often went unnoticed until traffic returned.
No View of the End-User Experience
- Server-side checks showed requests succeeding but not whether users could complete what they came to do.
- There was no evidence base for prioritizing front-end improvements.
Inconsistent Alerting and Escalation
- Alerts used different thresholds and notification routes across tools and teams.
- Escalation relied on informal knowledge of service ownership rather than an encoded on-call model.
Limited Traceability and Surge Readiness
- Without distributed tracing, cross-service issues could not be traced to their origin, prolonging root-cause analysis.
- During demand surges, saturation of connection pools, queues and downstream services was not visible before it caused user-facing failures.
Challenges
Implementation Plan
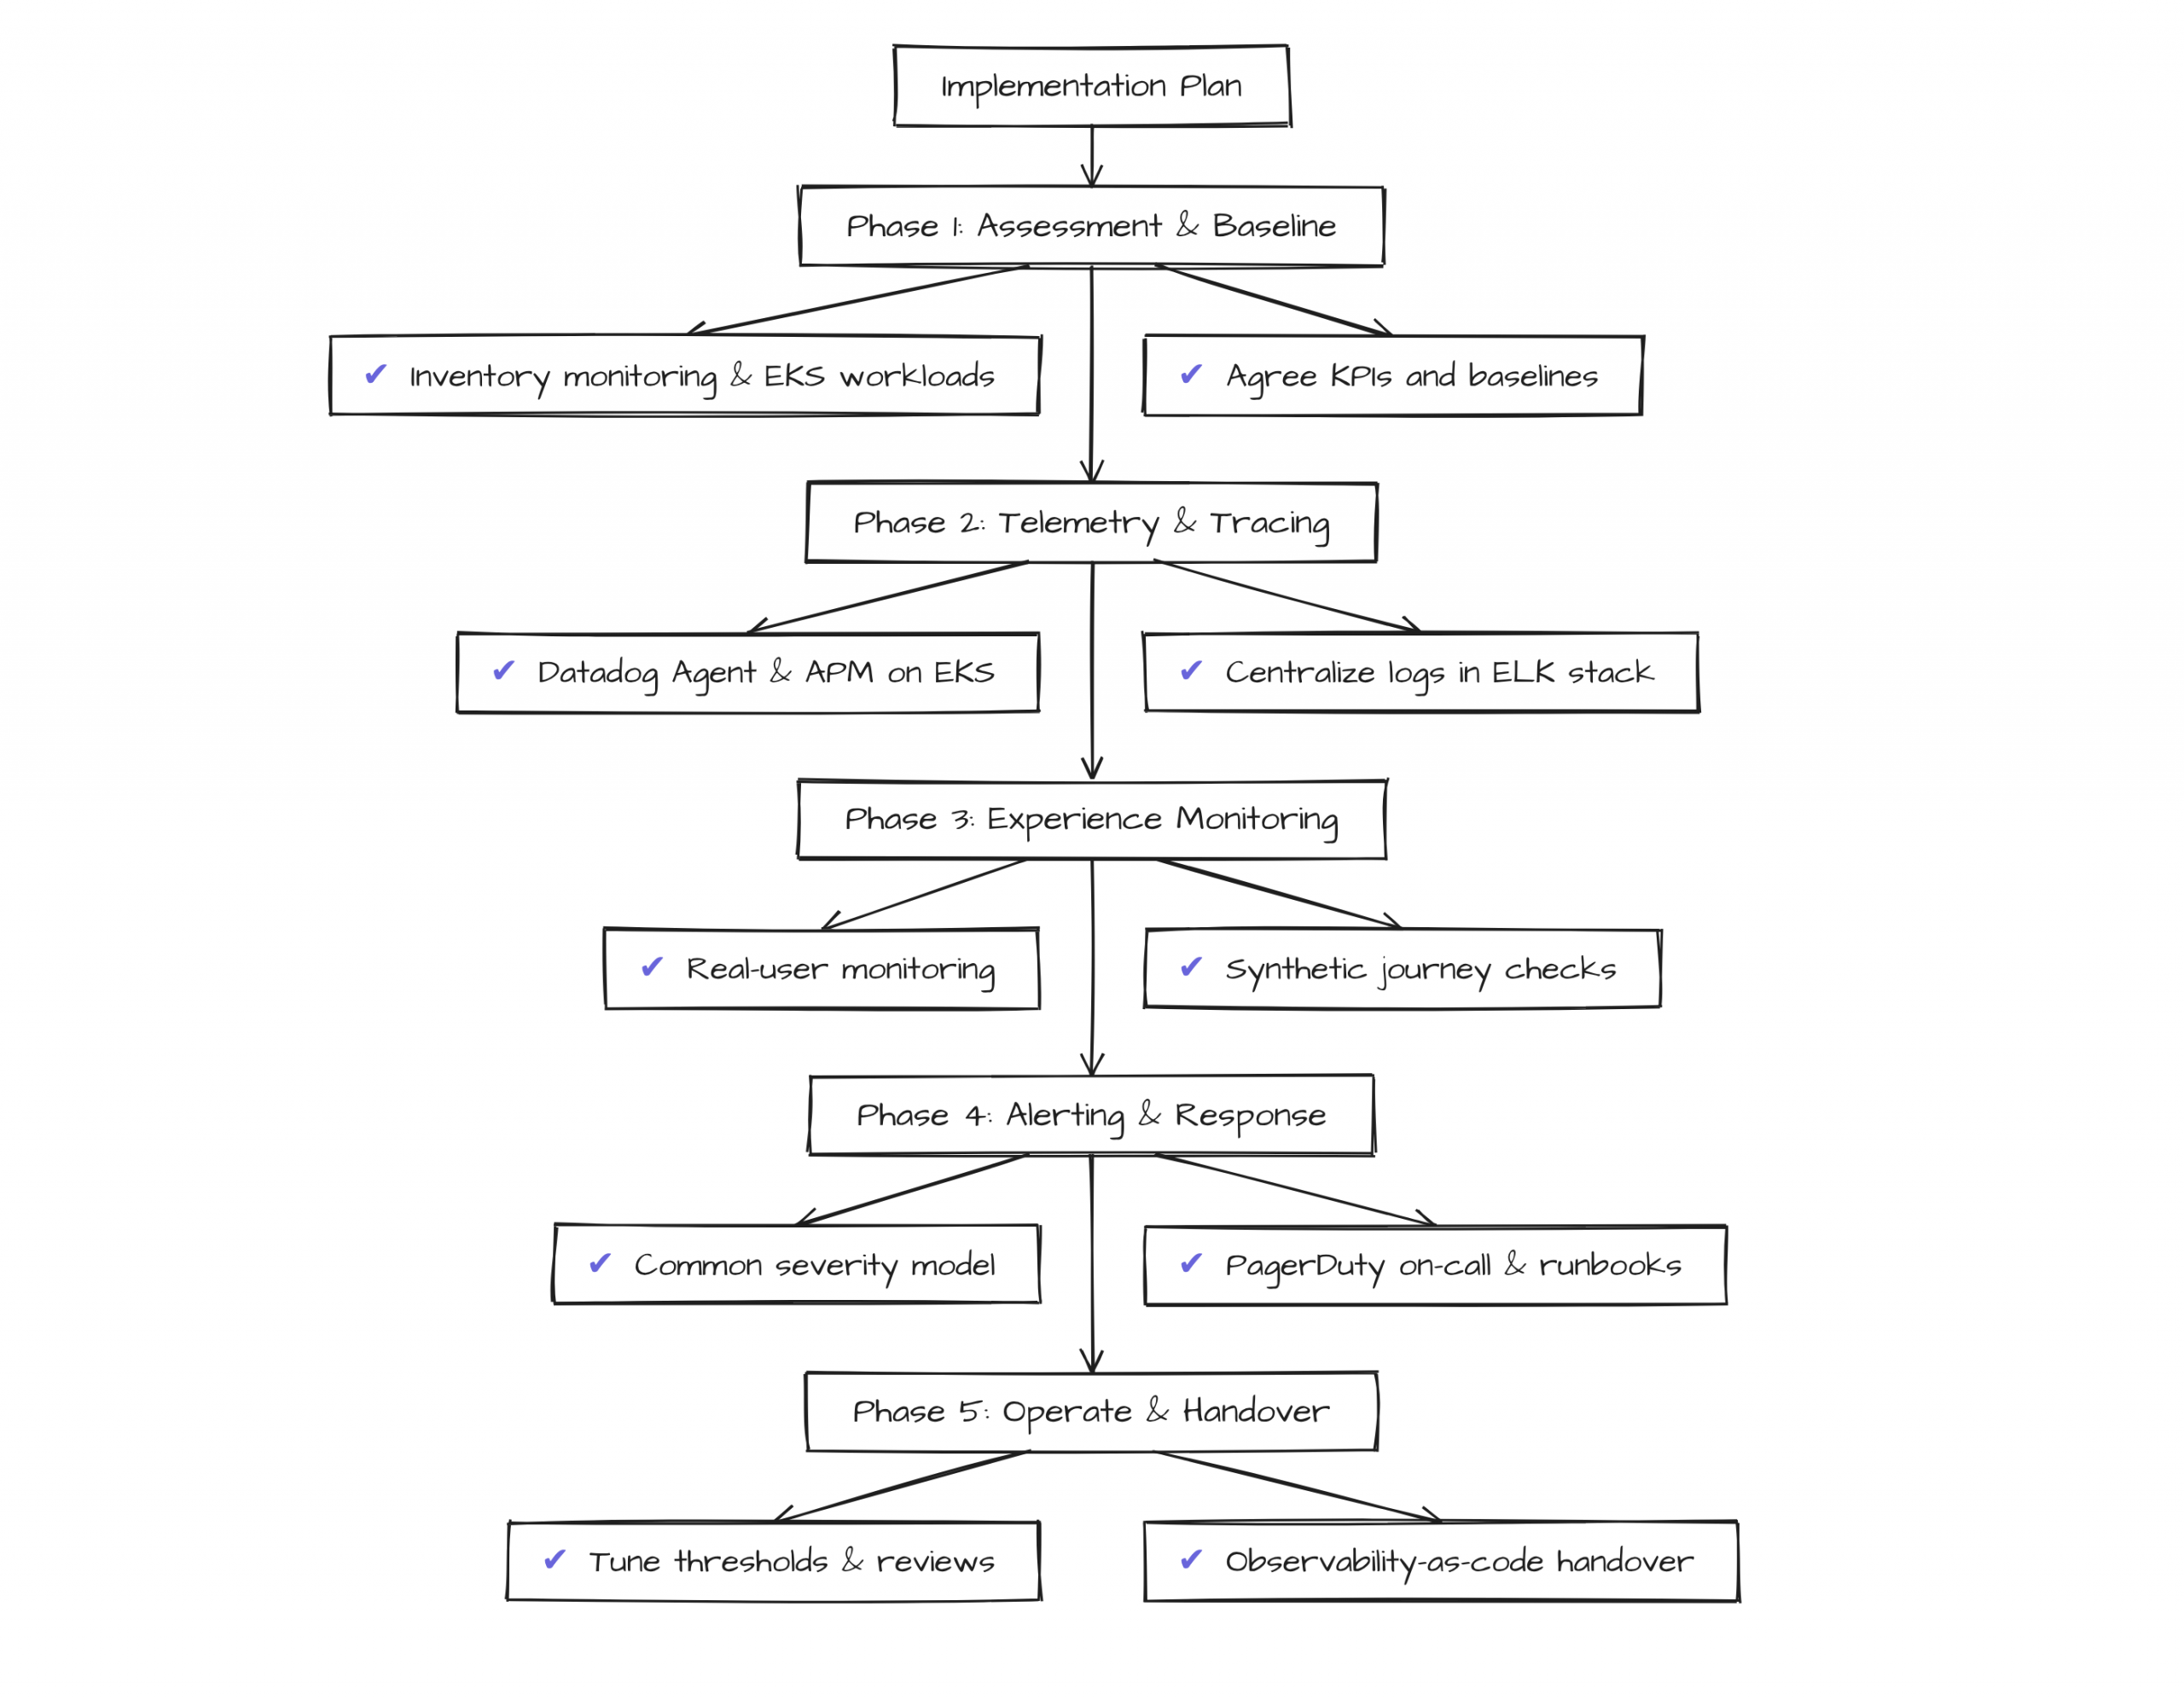
Assessment and Baseline
- Inventoried the existing monitoring estate and the EKS workloads, cluster topology and application services.
- Identified the four critical user journeys and six in-scope application services that define the platform’s mission function.
- Agreed KPIs and service levels with the organization before implementation, with coverage baselines from the tooling inventory and timing baselines from incident records.
Telemetry and Tracing
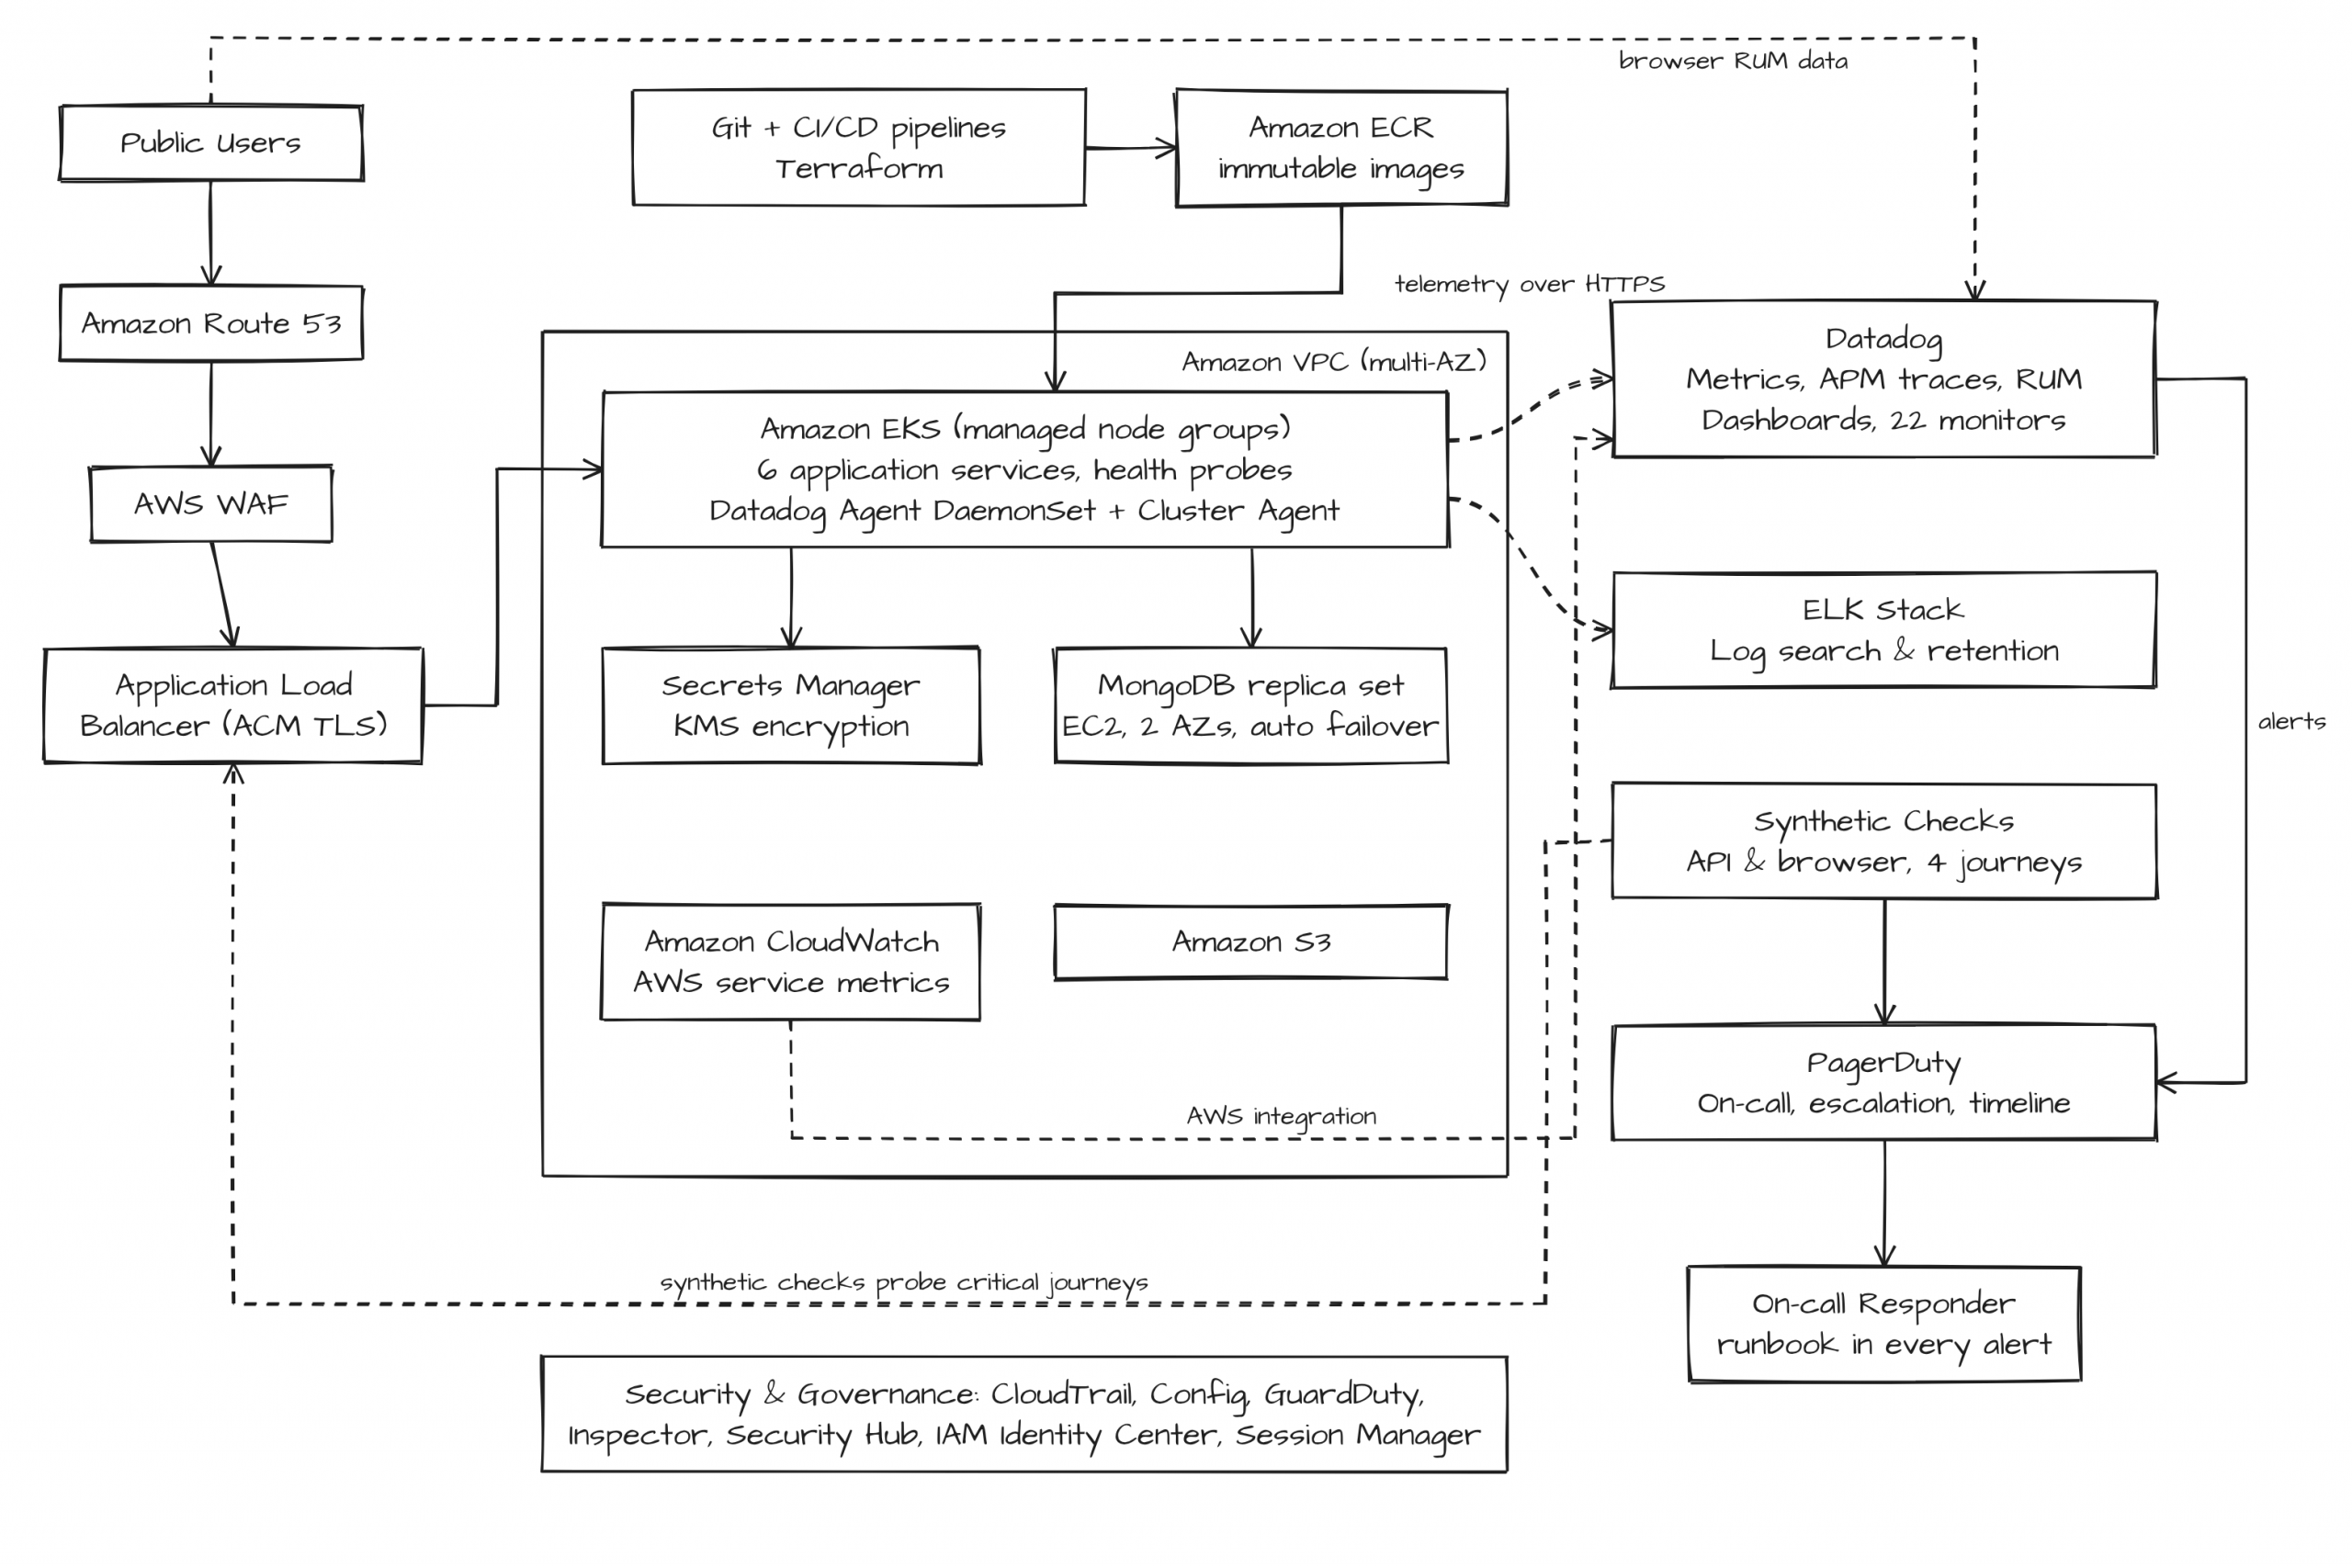
- Deployed the Datadog Agent as a DaemonSet with the Cluster Agent on Amazon EKS for node, pod and cluster telemetry.
- Instrumented services with Datadog APM for distributed tracing across service boundaries and into database and dependency calls.
- Centralized structured logs with correlation IDs in the ELK stack, and brought AWS service metrics and control-plane signals (CloudTrail, AWS Health, service quotas) into the same operational plane.
Experience Monitoring
- Implemented real-user monitoring to capture page performance, client-side errors and journey completion.
- Added Amazon CloudWatch Synthetics API and browser canaries that verify each critical journey on a fixed schedule from multiple locations, independent of live traffic.
Alerting and Incident Response
- Applied a common severity model to 22 standardized monitors: availability, latency and error-rate monitors for each service plus a synthetic check for each critical journey.
- Integrated monitoring with PagerDuty so every alert routes to the owning service’s on-call responder, escalates if unacknowledged and records an automatic incident timeline.
- Attached a runbook reference and links to correlated telemetry to every alert.
- Moved monitors, dashboards and synthetic tests into version-controlled configuration applied through the delivery pipeline.
Operate and Handover
- Ran the platform jointly with the organization’s team through a stabilization period to tune alert thresholds.
- Introduced post-incident reviews and periodic operational reporting on detection, restoration, alert quality and synthetic availability.
- Delivered five audience-aligned dashboards with role-based access and handed over the observability configuration repository with procedures for onboarding new services.
Solution Architecture
Tech Stack
Compute & Containers
- Amazon EKS with managed node groups across Availability Zones
- Amazon EC2
- Amazon ECR with immutable, version-tagged images
Networking & Edge
- Amazon VPC with public, private application and private data subnets
- Application Load Balancer, Amazon Route 53, AWS WAF, AWS Certificate Manager
- VPC endpoints and NAT Gateways
Data & Storage
- MongoDB replica set across two Availability Zones with automated failover
- AWS KMS encryption at rest
- Amazon S3
Security & Governance
- AWS Organizations, AWS IAM Identity Center, AWS Secrets Manager
- AWS CloudTrail, AWS Config, Amazon GuardDuty, Amazon Inspector, AWS Security Hub
- AWS Systems Manager Session Manager
Monitoring & Incident Response
-
Amazon CloudWatch
- Datadog (infrastructure metrics, APM, real-user monitoring, dashboards)
- Amazon CloudWatch Synthetics API and browser canaries for the four critical journeys
- ELK stack for log aggregation and search
- PagerDuty for on-call, escalation and incident timelines
Delivery
-
Git-based CI/CD pipelines
- Terraform for infrastructure and observability as code
Benefits and Value Achieved
-
Faster detection: Mean time to detect reduced from ~35 minutes to under 5 minutes (>85% reduction).
- Faster restoration: Mean time to restore reduced from ~90 minutes to under 30 minutes (>66% reduction).
- Continuous journey verification: 4 of 4 critical journeys verified continuously by Amazon CloudWatch Synthetics, with ≥98% synthetic availability.
- End-to-end traceability: 6 of 6 in-scope services emit distributed traces, and 4 of 4 journeys are instrumented for real-user monitoring.
- Owned, consistent alerting: 22 of 22 monitors routed to an on-call service with a severity and escalation policy; 6 of 6 services have encoded escalation.
- Single operational view: Five audience-aligned dashboards across infrastructure, container, application, log, real-user and synthetic signals.
- Repeatable operating model: Observability as code and alert-linked runbooks let new services be onboarded without rebuilding the model.
Customer Testimonial
“People use our platform at the moment they need help, so we can’t depend on them to tell us something is broken. CloudJournee gave us one connected view of our services, synthetic checks on our critical journeys around the clock, and on-call alerting that reaches the right person every time. We now detect issues in under five minutes and restore service in under 30. Just as important, our own team can run and extend the setup without relying on a few experts.”
– IT Infrastructure Manager, Leading Nonprofit Organization